
AI-PoweredCatastrophe Models
Fast, global, location-level models of hail, tornado and straight-line wind, built and validated for insurance decisions.
 U.S. National Science FoundationNSF SBIR Phase I & II



WHY AI
No single source
sees the whole storm.
Traditional cat modellingRadar, atmospheric data and storm reports describe different parts of a storm. Bringing them together through hand-written physics and heuristics means coding relationships, exceptions and approximations.
Vāyuh’s physics-informed AILearn the relationships across these sources, reducing the need for hand-written rules and enabling us to generate more storm scenarios, faster.
Explore our storm modelsSEVERE CONVECTIVE STORM MODELS
Built around each peril.
Hail, tornado and straight-line wind behave differently. Our models reflect those differences, with flexible event definitions for how you assess risk.

Hail
Hail size, frequency and local footprints, from individual storms to large outbreaks.

Tornado
Tornado tracks, widths and intensity, resolved around the locations that matter to you.

Straight-line wind
Wind speed and damaging footprints across storm types, from downbursts to derechos.
- Hazard maps
- Event catalogs
- Loss estimates
Coverage, resolution and delivery vary by peril and region.
THE STORM CATALOG
Better loss estimates.
Built on millions of simulated storms.
Large simulated storm catalogs reduce sampling noise, giving you a more stable estimate of loss at each location.
Explore portfolio risk
A more stable view of loss.
Estimated annual loss
LOCATION-LEVEL HAZARD
Detailed risk at each location,
calibrated to extremes.
Local hail intensity, checked against historical extremes.
Review calibration and evidenceAt the extremes.
| Location | Observed | Vayuh |
|---|---|---|
| 1Texas | 6.12 in | 6.00 in |
| 2Alabama | 4.50 in | 4.18 in |
Hail size in inches.
183 of 187 reports had severe predicted hail within 50 km.
ASSET-LEVEL INTELLIGENCE
Asset details
shape the risk.
Vehicles in an open lot, covered inventory and building roofs respond differently to the same storm. Understand what is exposed at each site.

LOSS MODELLING
An alternative
view of risk.
For insurers, reinsurers and brokers comparing location-level hazard and portfolio loss alongside existing models.
- Hazard data
- Event footprints, storm frequency and intensity at your locations.
- Loss estimates
- Average annual loss and loss-cost comparisons, based on exposure and vulnerability assumptions.
- Delivery
- Event sets for the Oasis Loss Modelling Framework (Oasis LMF), or a portfolio analysis prepared with our team.

GLOBAL SEVERE CONVECTIVE STORM MODELS
Global storm
risk models.
A consistent view of severe convective storm risk for portfolios that cross markets.
CASE STUDIES
See the models
in action.
Focused studies of storm risk across different assets.
THE STANDARD
Insurance-grade
risk intelligence.
Evaluate the assumptions, the evidence and what the results mean for your portfolio.
Run it on your locations.Hazard
Observed storms.
Review frequency and intensity against observations.
Event sets
Local stability.
Examine storm footprints and how estimates converge.
Calibration
Tailored to you.
Calibrate to your assets and experience, with adjustments documented.
INDUSTRY PERSPECTIVES
In their words.
Vayuh's hail model is the best I've seen in my 15 years working on severe convective storms. Their approach is fundamentally different and superior to anything else in the market. This is the future of risk modeling.
It's been an honour working with Vayuh.AI and their state-of-the-art, novel approach to understanding the impact of climate change on perils. Their application of machine learning techniques places Vayuh.AI at the forefront of a new wave of insurance-ready climate-based solutions, with a set of meticulously constructed and detailed models that has the potential to replace the hierarchy of current modeling-based solutions. They truly are a testament to the future.
I see the importance of using climate, AI to form an alternative view of hazard modules in catastrophe models and Vayuh is best placed for this.
Company
Built by scientistswho ship.
A team out of the UC Berkeley AI/ML research community — supported by the U.S. National Science Foundation under SBIR Phase I & II, and backed by operators across insurance, infrastructure, and ML systems.
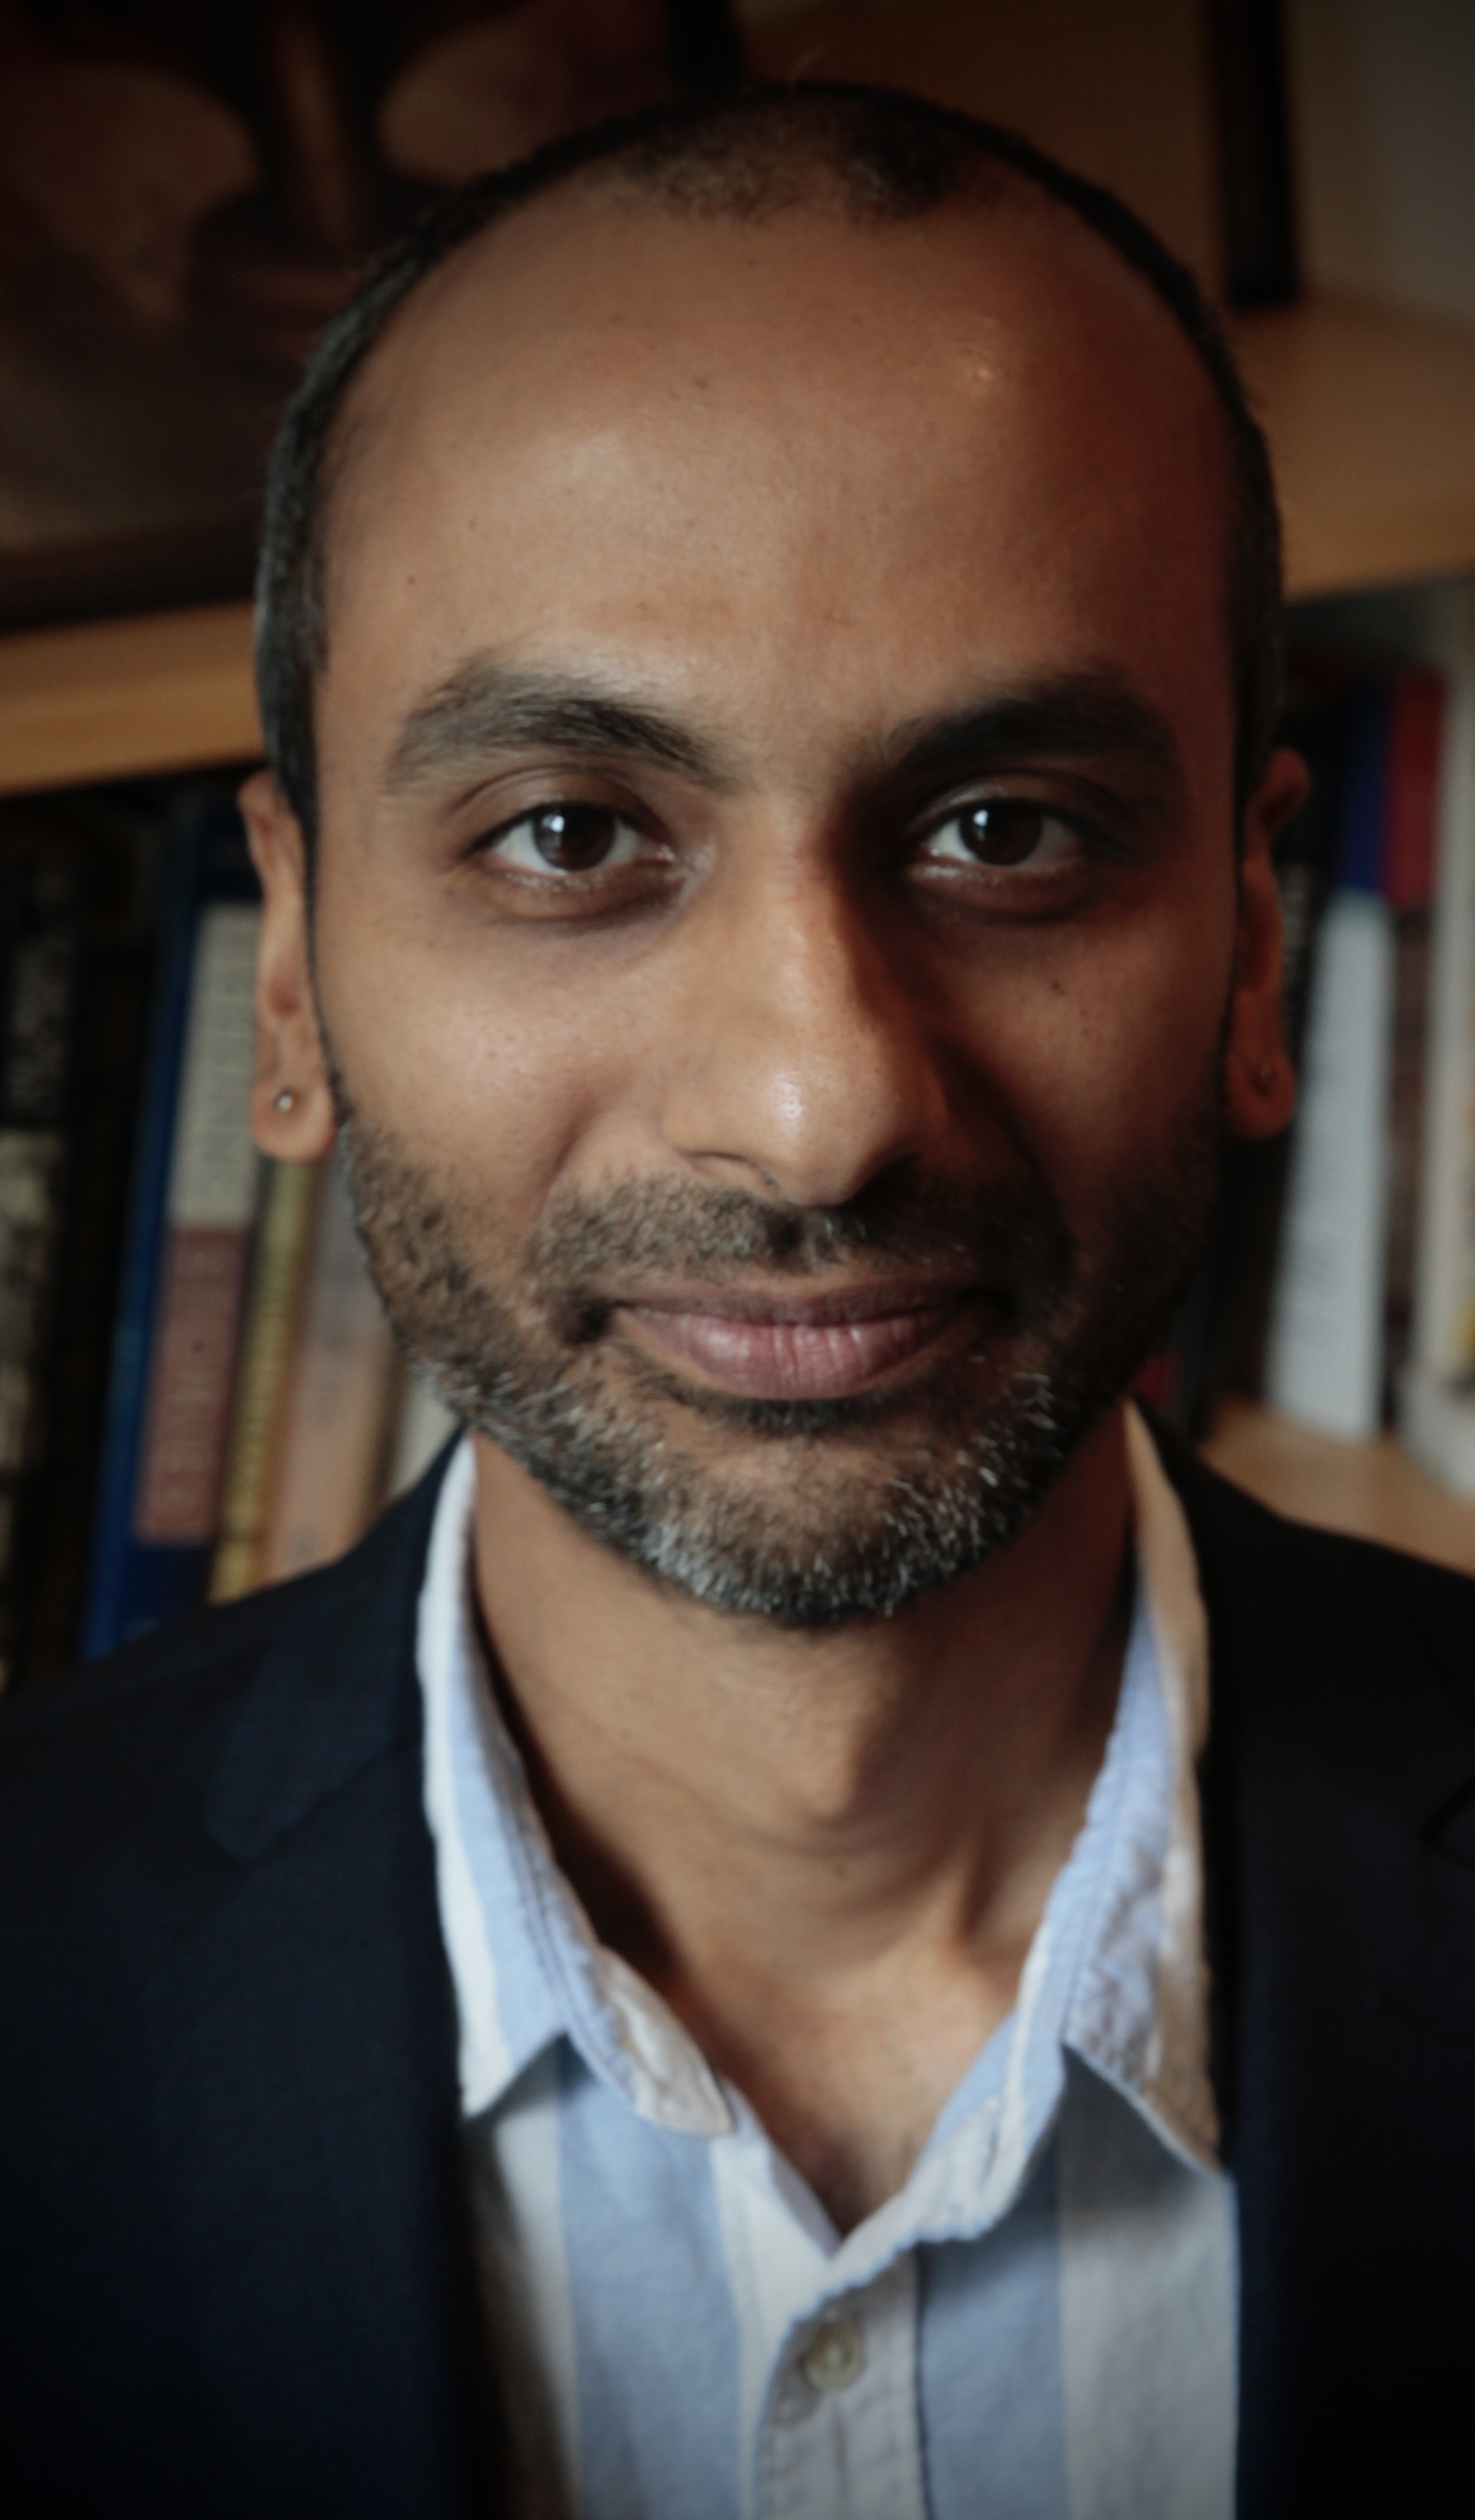 TeamMayur Mudigonda, Ph.D.Founder & CEO→
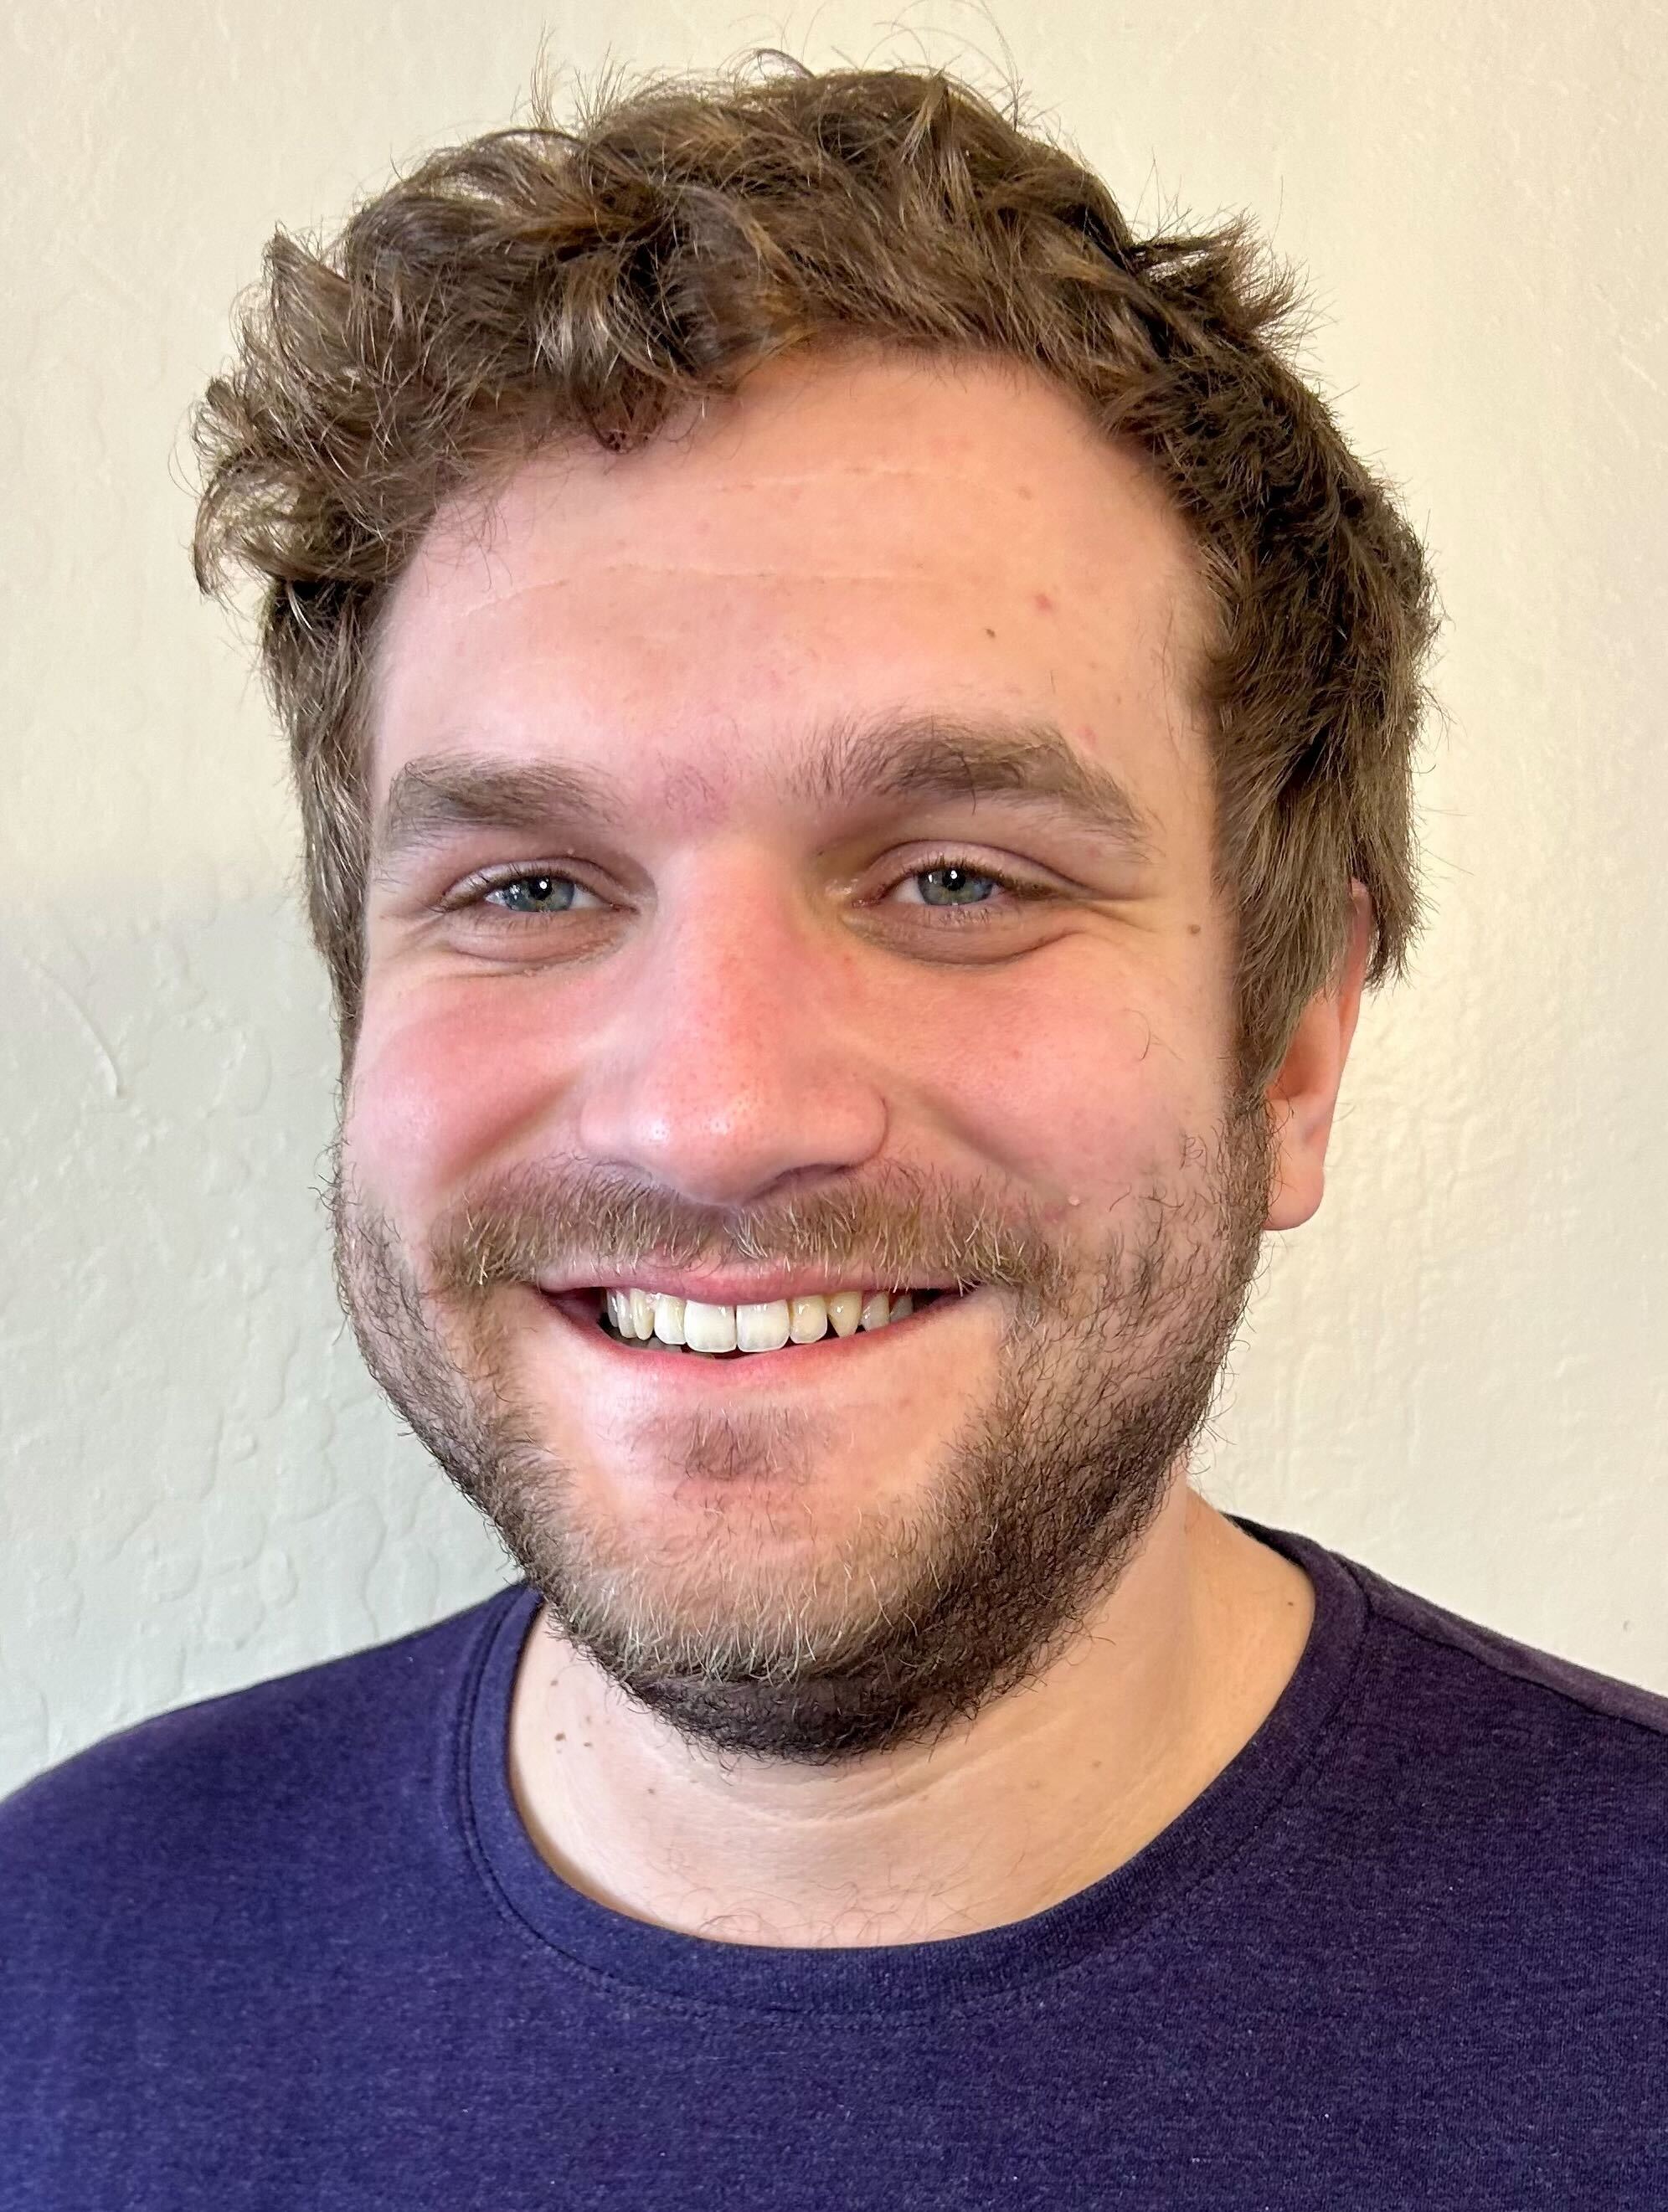 TeamBlake TickellAI Research Engineer→
 TeamSabbihAI Research Engineer→
 TeamAbhimanyu AroraProduct & Engineering→
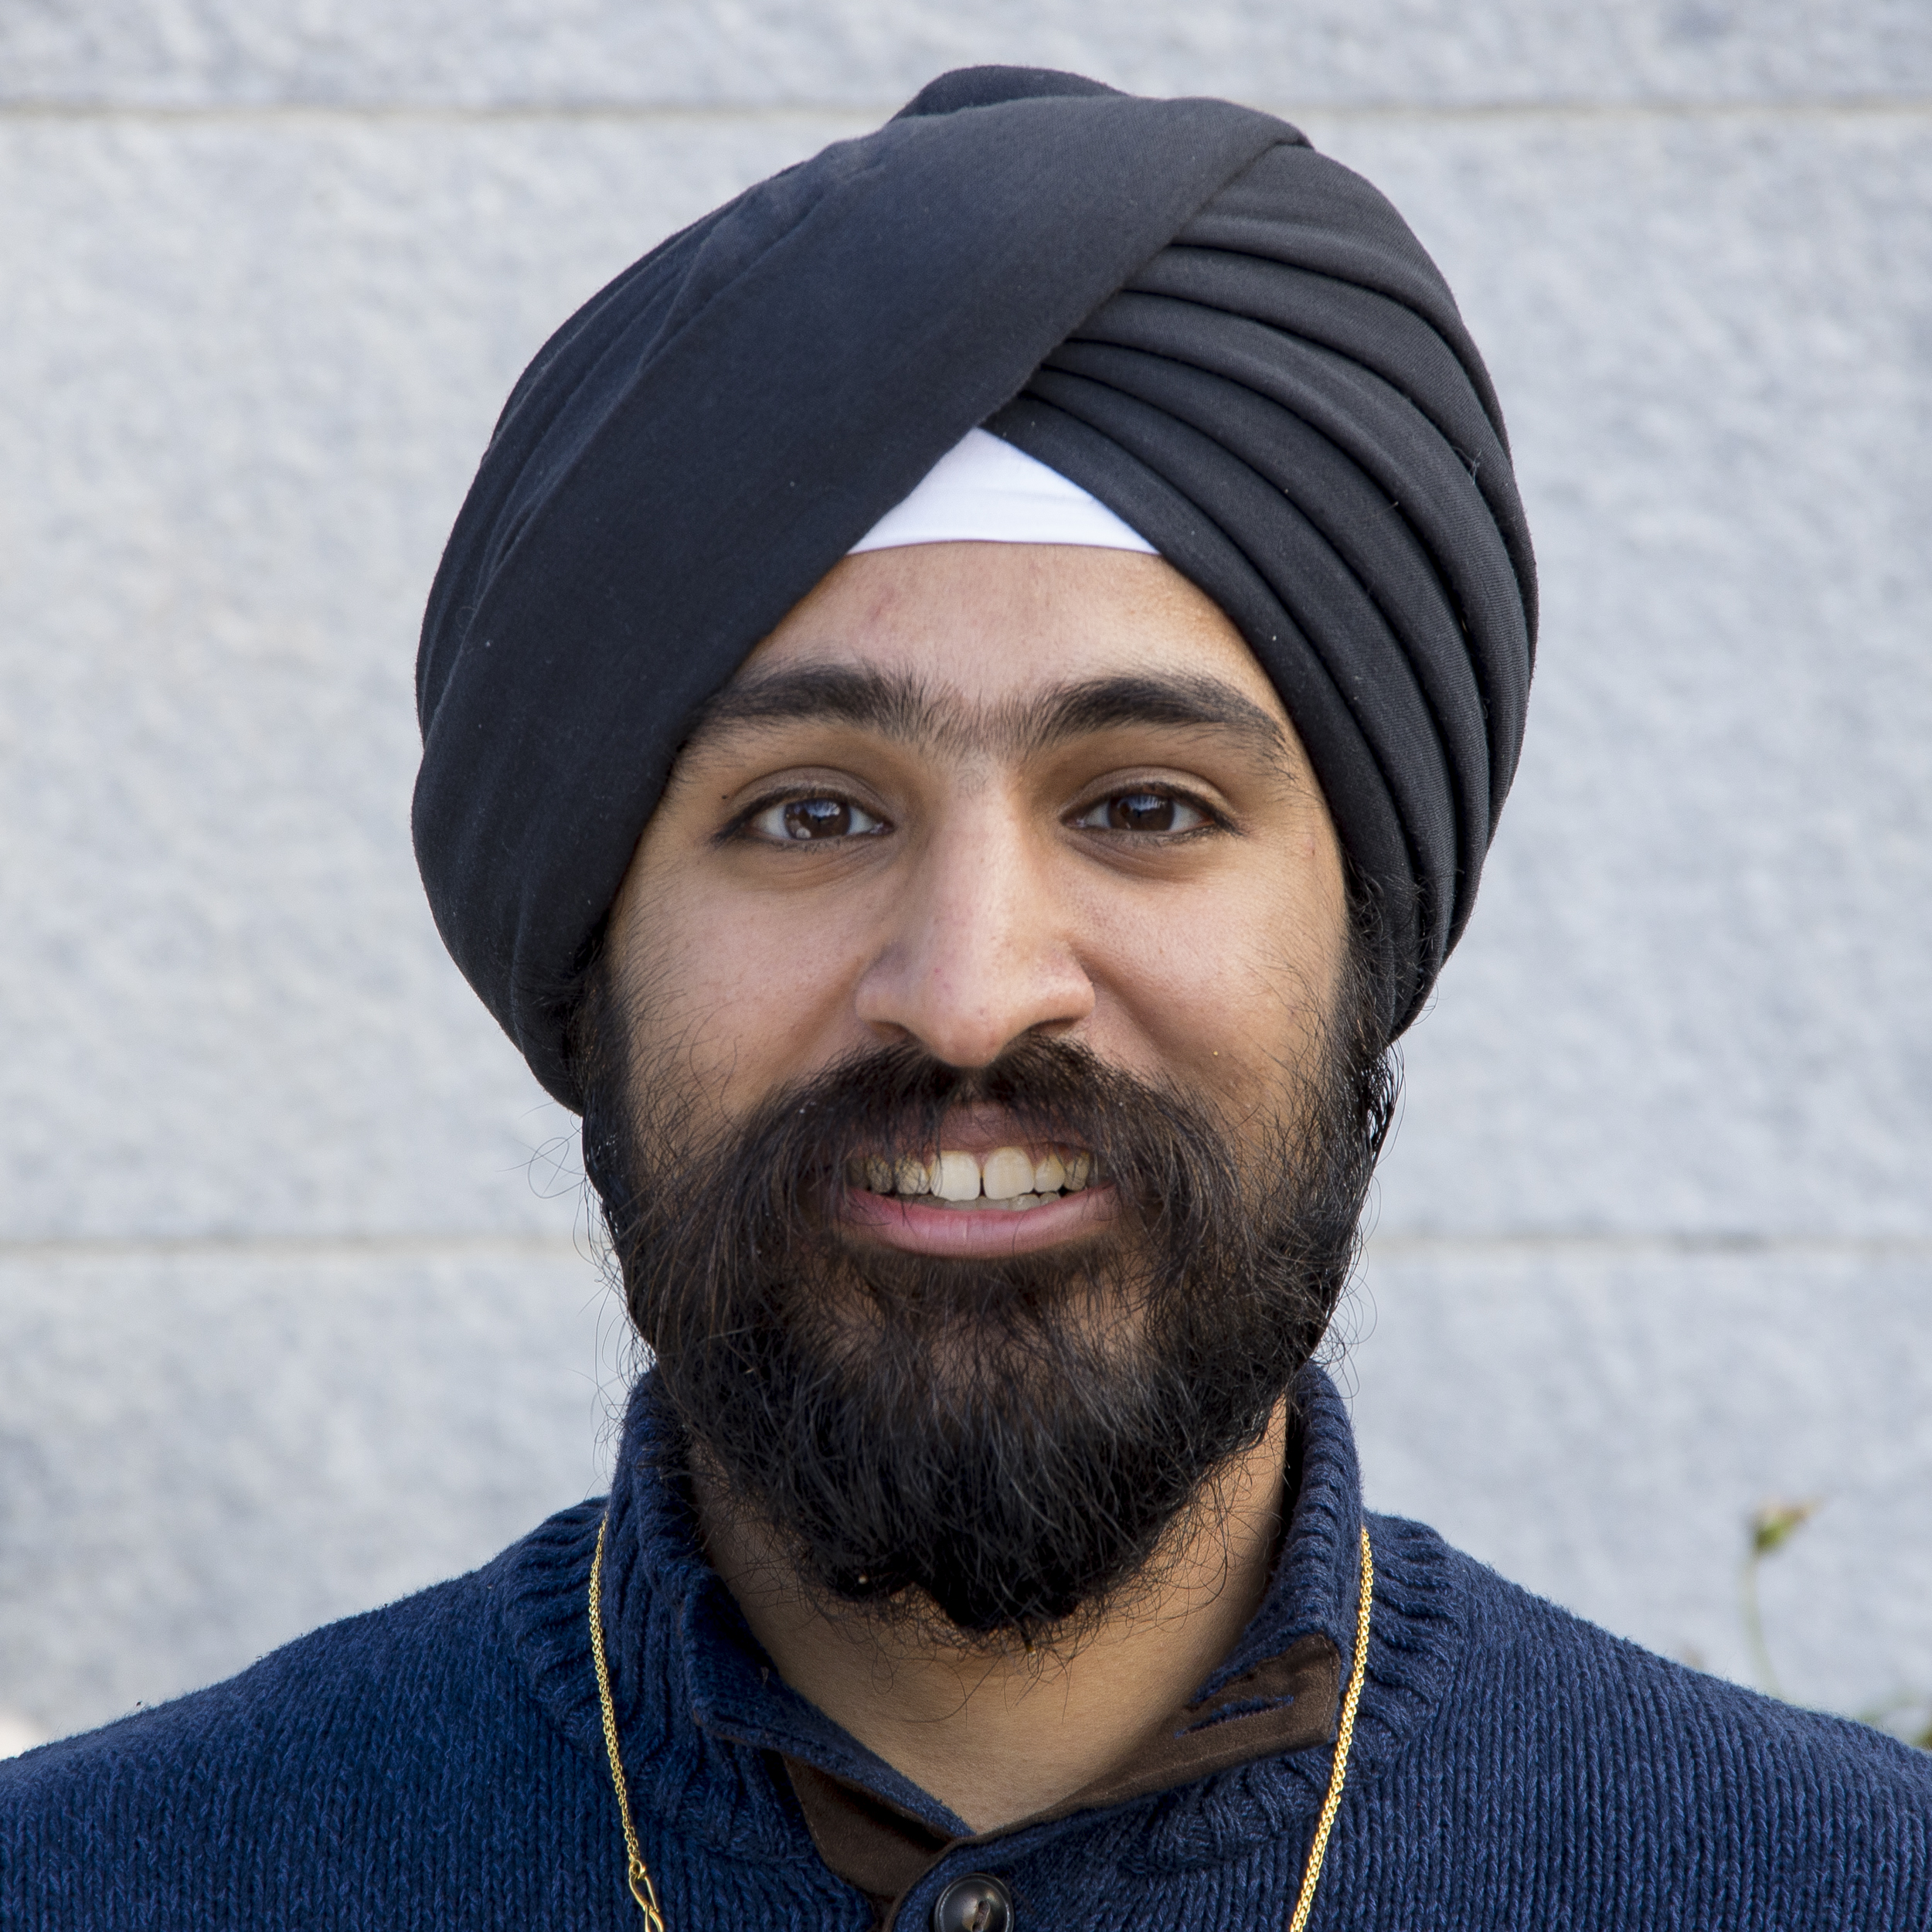 AdvisorPratik Sachdeva, Ph.D.Scientific Advisor→
 AdvisorKyle BeattyInsurance Advisor→
 AdvisorChandiniBusiness Development Advisor→
 AdvisorPrabhat Ram, Ph.D.Principal, Microsoft Azure; Berkeley Lab→
 AdvisorOlivier CollignonDirector of Product, RMS; Cape Analytics→
 AdvisorAshesh Chattopadhyay, Ph.D.Assistant Professor, UCSC→
 InvestorAndy KonwinskiCo-Founder, Databricks & Perplexity→
 InvestorFarid JiandaniJiandani Family Fund→
 InvestorBharath MadhusudhanCo-Founder, Securly→
 InvestorZayd EnamCo-Founder, Cresta.ai→
START WITH YOUR PORTFOLIO
See what the models
mean for you.
Choose a peril and a few locations. We’ll scope the outputs and review the results, assumptions and available evidence together.
Run it on your locations.